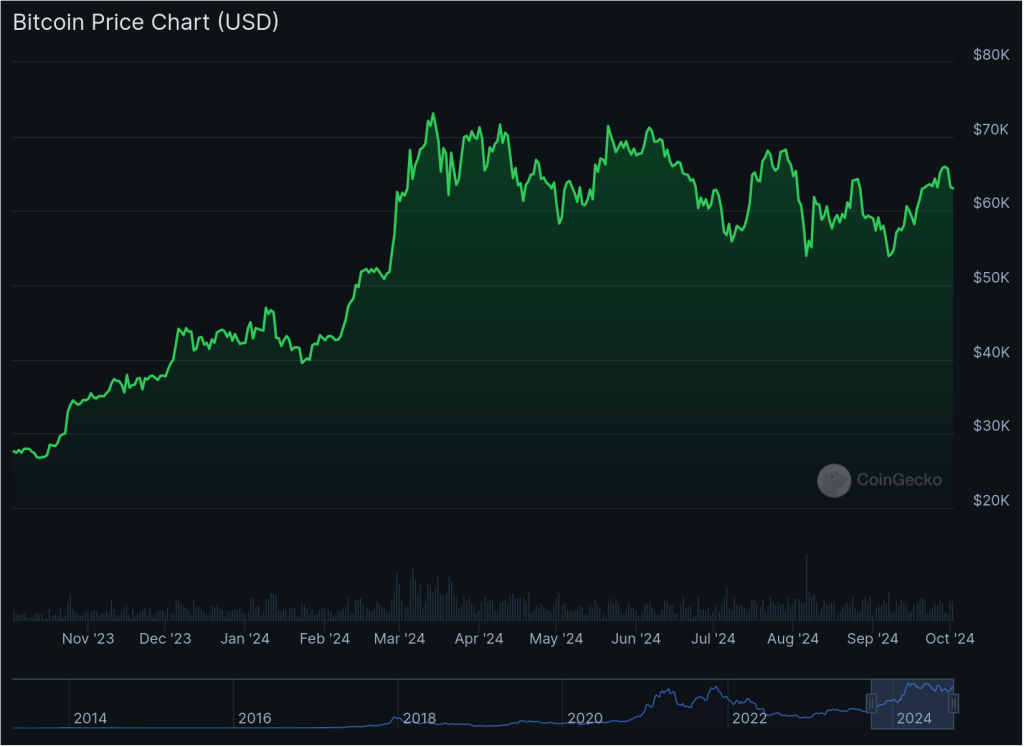
It has been 8 months since Bitcoin price chop around 55 k ~ 65 k level. General consensus for the rally from cycle low to 60 k level is that Bitcoin spot ETF rumors spread, then ETF happened and then actual net positive inflows.

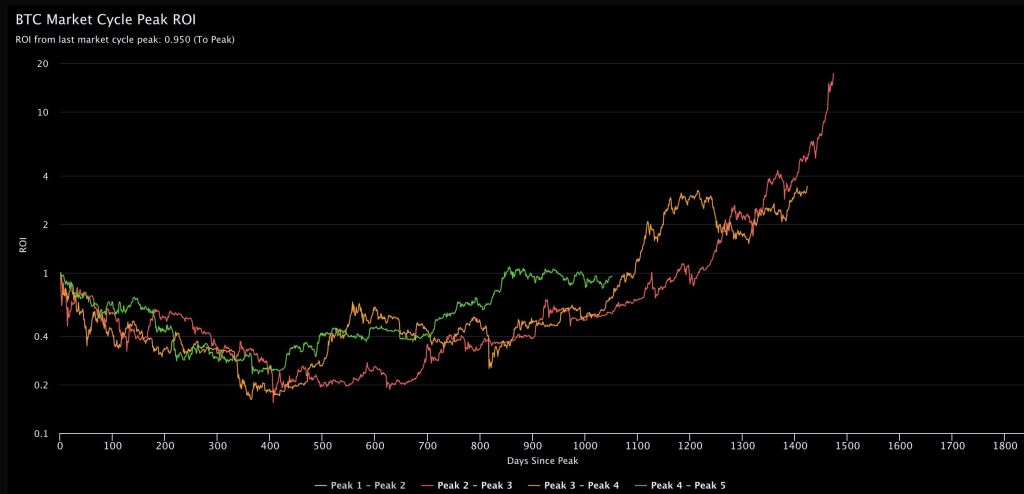
Another chart that is hot in Oktober is BTC Market Cycle Top ROI

Green line shows currect cycle. If history repeats itself this is bullish.
Oktober, November and April are historically bullish months. The chart below says everything. Again, if history repeats itself, Oktober and November are expected to be green.

One more bullish news is that FED, China and European Central Bank reducing interest rates. These theree major economies together make approximately 60% of the global GDP and could create additional demand.

Hi, this is a comment.
To get started with moderating, editing, and deleting comments, please visit the Comments screen in the dashboard.
Commenter avatars come from Gravatar.
[…] Read my other articles: https://marracapital.org/october2024/ […]